 2 months ago
62
2 months ago
62
Christine Jeavans and Phil Leake,data journalists, BBC Verify

 Getty Images
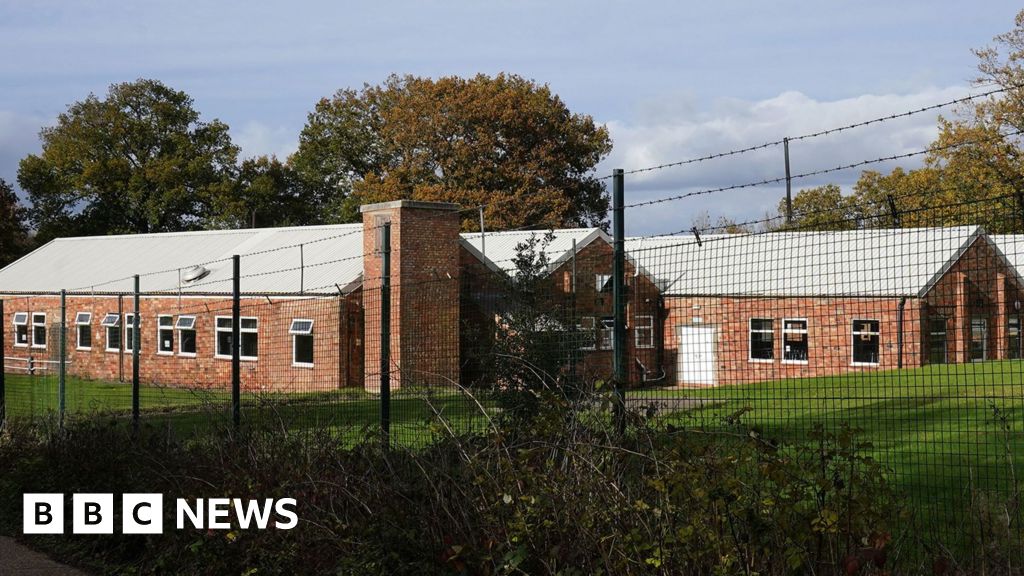
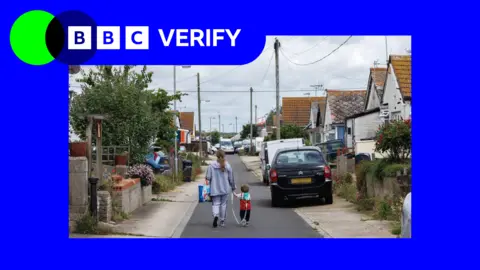
Jaywick near Clacton-on-Sea in Essex is among several coastal communities with high levels of deprivation
Jaywick, near Clacton-on-Sea in Essex, has been named the most deprived neighbourhood in England for the fourth consecutive time since 2010, new data shows.
Seven areas in Blackpool are also among the 10 most deprived, alongside one in Hastings and one in Rotherham, according to stats published by the Ministry for Housing, Communities and Local Government (MHCLG) on Thursday.
Half of the neighbourhoods in Middlesbrough are very deprived, making it the local authority with the highest proportion, ahead of Birmingham and Hartlepool.
Deprivation is spread across the country, with 65% of local authorities containing at least one highly deprived neighbourhood, up from 61% in 2019.
The MHCLG's Index of Multiple Deprivation looks at living conditions across an area - but does not mean that everyone in a highly deprived neighbourhood will be struggling, nor will all those in a less deprived area be well off.
The new figures do not show whether an area has become more or less well off since the previous report, but instead can show patterns of how areas have changed relative to each other.
There are pockets of deprivation surrounded by less deprived places in every region of England.
Jaywick topped the list having been previously found to be the most deprived area in the last three reports, released in 2010, 2015 and 2019.
The MHCLG found 82% of areas found to be the most deprived in 2025 were already in that category in 2019.
The department used a number of weighted metrics to determine a neighbourhood's level of deprivation, including income, crime and barriers to housing.
They are then assessed as more or less deprived compared to other neighbourhoods.
The report found that Tower Hamlets and Hackney in London had the highest levels of income deprivation among households with children.
Meanwhile, nine of the 10 local authority districts with the highest levels of income deprivation among older people are in London.
The report is the latest in a long-running series that are used by central and local government and other bodies to target resources for local services.
The government's recently announced Pride in Place funding - offering "overlooked" communities a share of £5bn - was allocated in part based on the deprivation figures from 2019.
Areas with a history of heavy industry or mining are particularly affected, the report's authors highlight, along with parts of East London and several coastal towns including Jaywick.
The former holiday resort was visited by the UN special rapporteur for extreme poverty as part of a fact-finding mission in 2018.
And last year, its local district council, Tendring, agreed a £126m 20-year improvement plan.
The previous Conservative government also used deprivation figures, along with other criteria, when deciding where would receive "Levelling Up" grants.
Scotland, Wales and Northern Ireland also have Indices of Multiple Deprivation which are each published separately. No dates have yet been announced for these updates.
How is deprivation measured?
The Index of Multiple Deprivation ranks all of England's 33,755 neighbourhoods, each with an average of 1,500 people, by their deprivation score.
The score is calculated from data on income, employment, education, crime, health and disability, barriers to housing and services, and the living environment.
Once all the neighbourhoods are ranked, they are split into 10 equal groups called deciles, where the first decile is the 3,375 most deprived neighbourhoods and so on.
We are using terms like "highly deprived" and "most deprived" to refer to this group of neighbourhoods. There are areas of deprivation throughout England and not everyone in a neighbourhood will experience deprivation equally.
Additional reporting by Jess Carr, Libby Rogers and Lucy Dady